
Using your Financial Summary page
The Financial Summary page is available only after a final estimate has been provided by a professional estimator. To learn how to get one, click here.
To gain a thorough understanding on your financial summary page, get familiar with the legend:
- Accepted: Quotes you have accepted that have planned payments not yet due (orange hatched).
- Allocated: Payments set aside via your Digital Wallet but not yet paid (burnt orange).
- Paid: Payments completed (orange).
- Projected Savings: Expected savings (green hatched).
- Savings: Actual savings after payments (green).
- Projected Over Budget: Expected overspending (red hatched).
- Over Budget: Actual overspending (red).

Breakdown of the page
Current Budget Summary
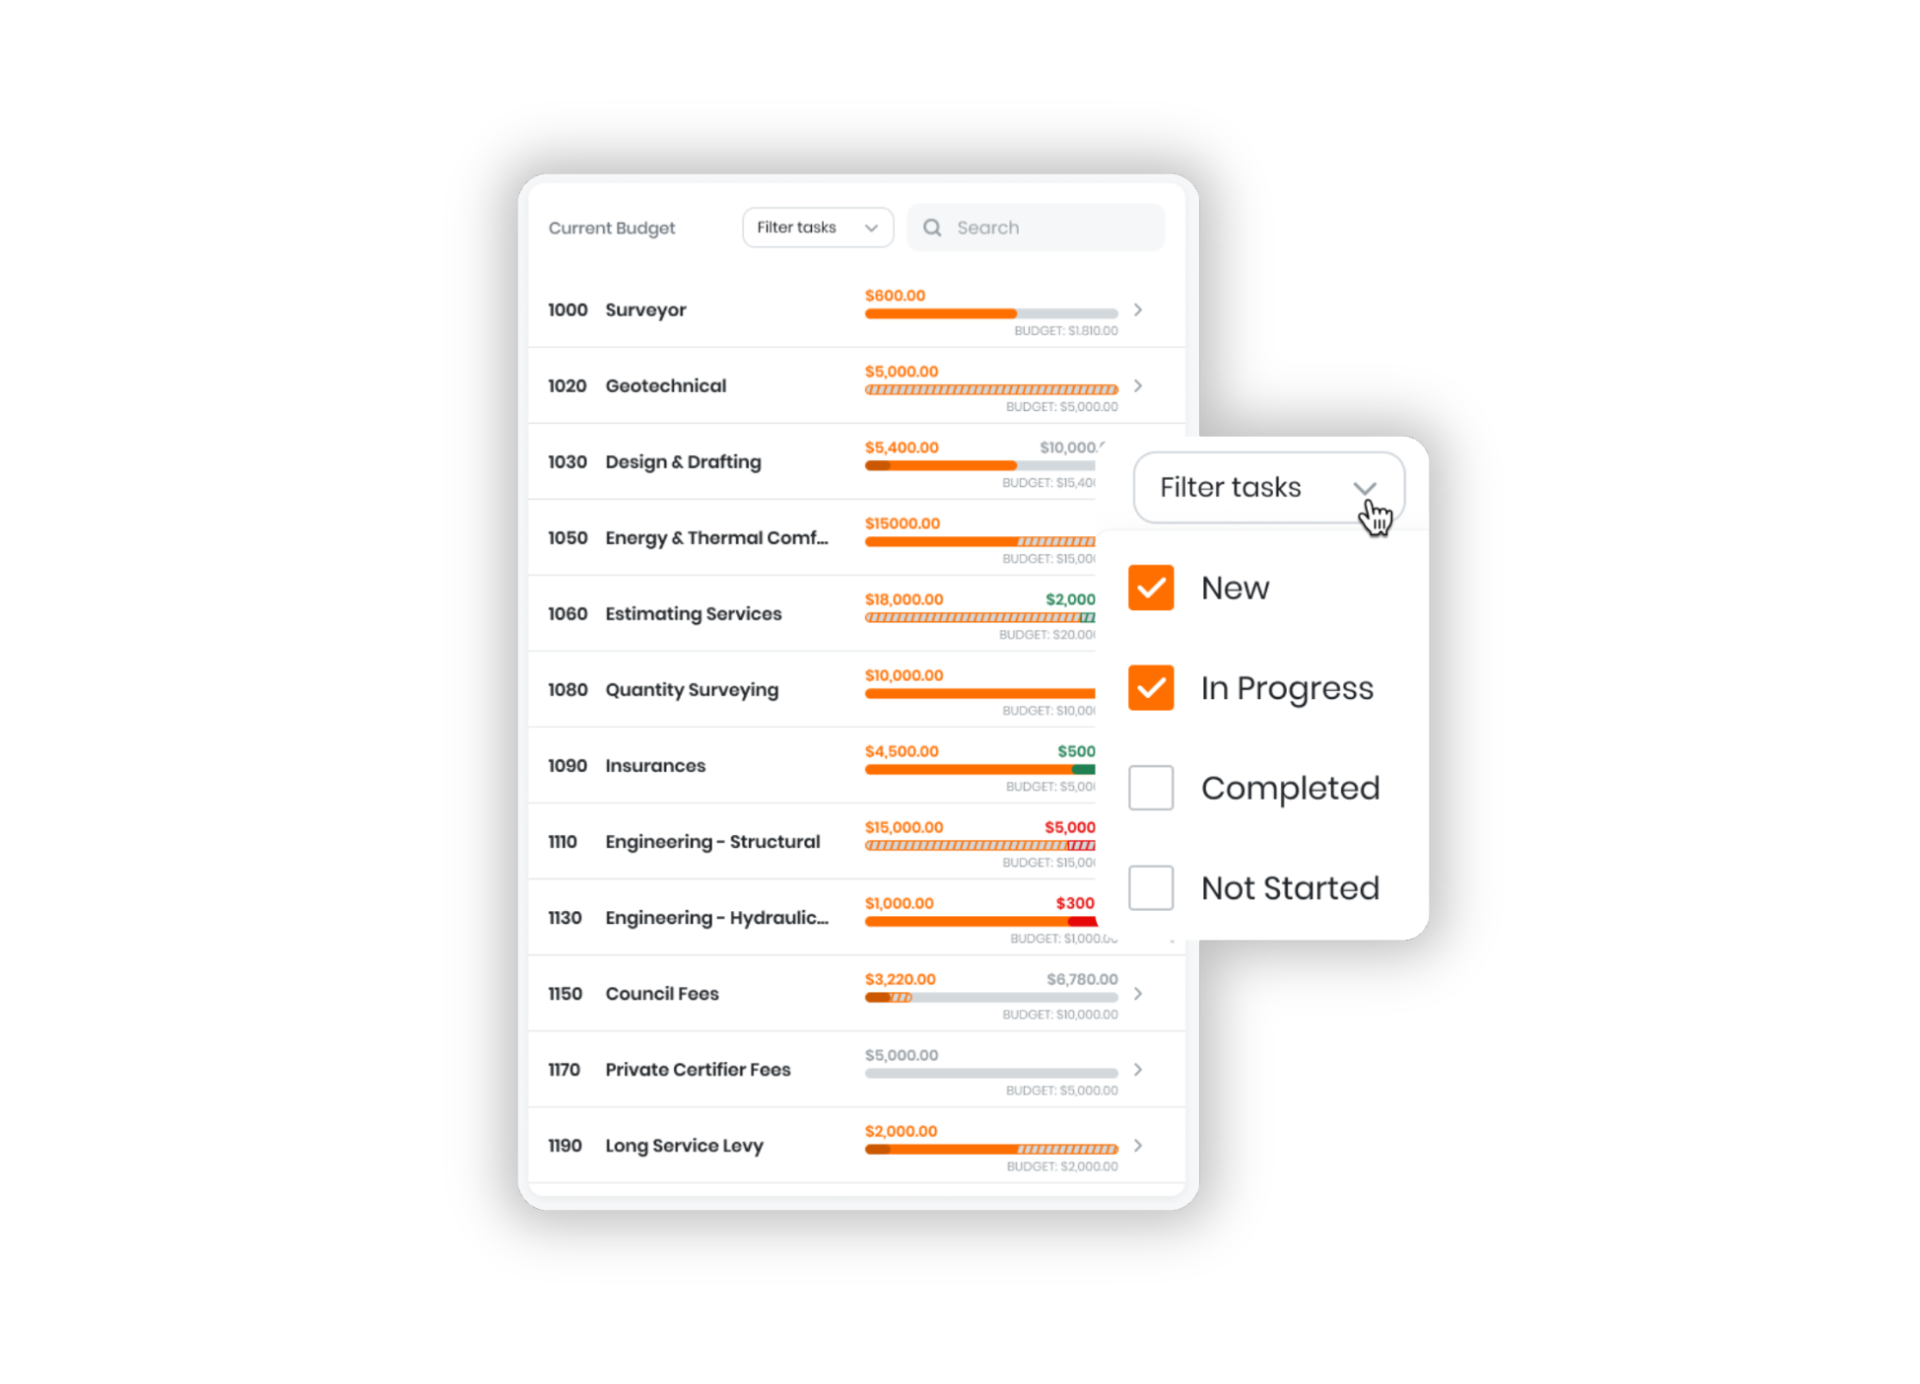
A cost centre/code is like a specific bucket where you put all the costs related to a certain part of your project. The purpose of a cost centre/code is to help organise and monitor expenses by grouping related costs together, making it easier to manage and review your budget.
On the left side of the page, you’ll see a list of cost centres or cost codes from your final estimate (e.g., surveyor, geotechnical). This section shows your budget for each cost centre and how you're tracking against it. You can also the dropdown and search bar on the left tile to filter and search for specific tasks, such as new tasks, in progress, or completed.
Click on a cost centre to go to the Estimate Budget page for more details. Learn more about the Estimate Budget page here.
Budget Tracking Wheel
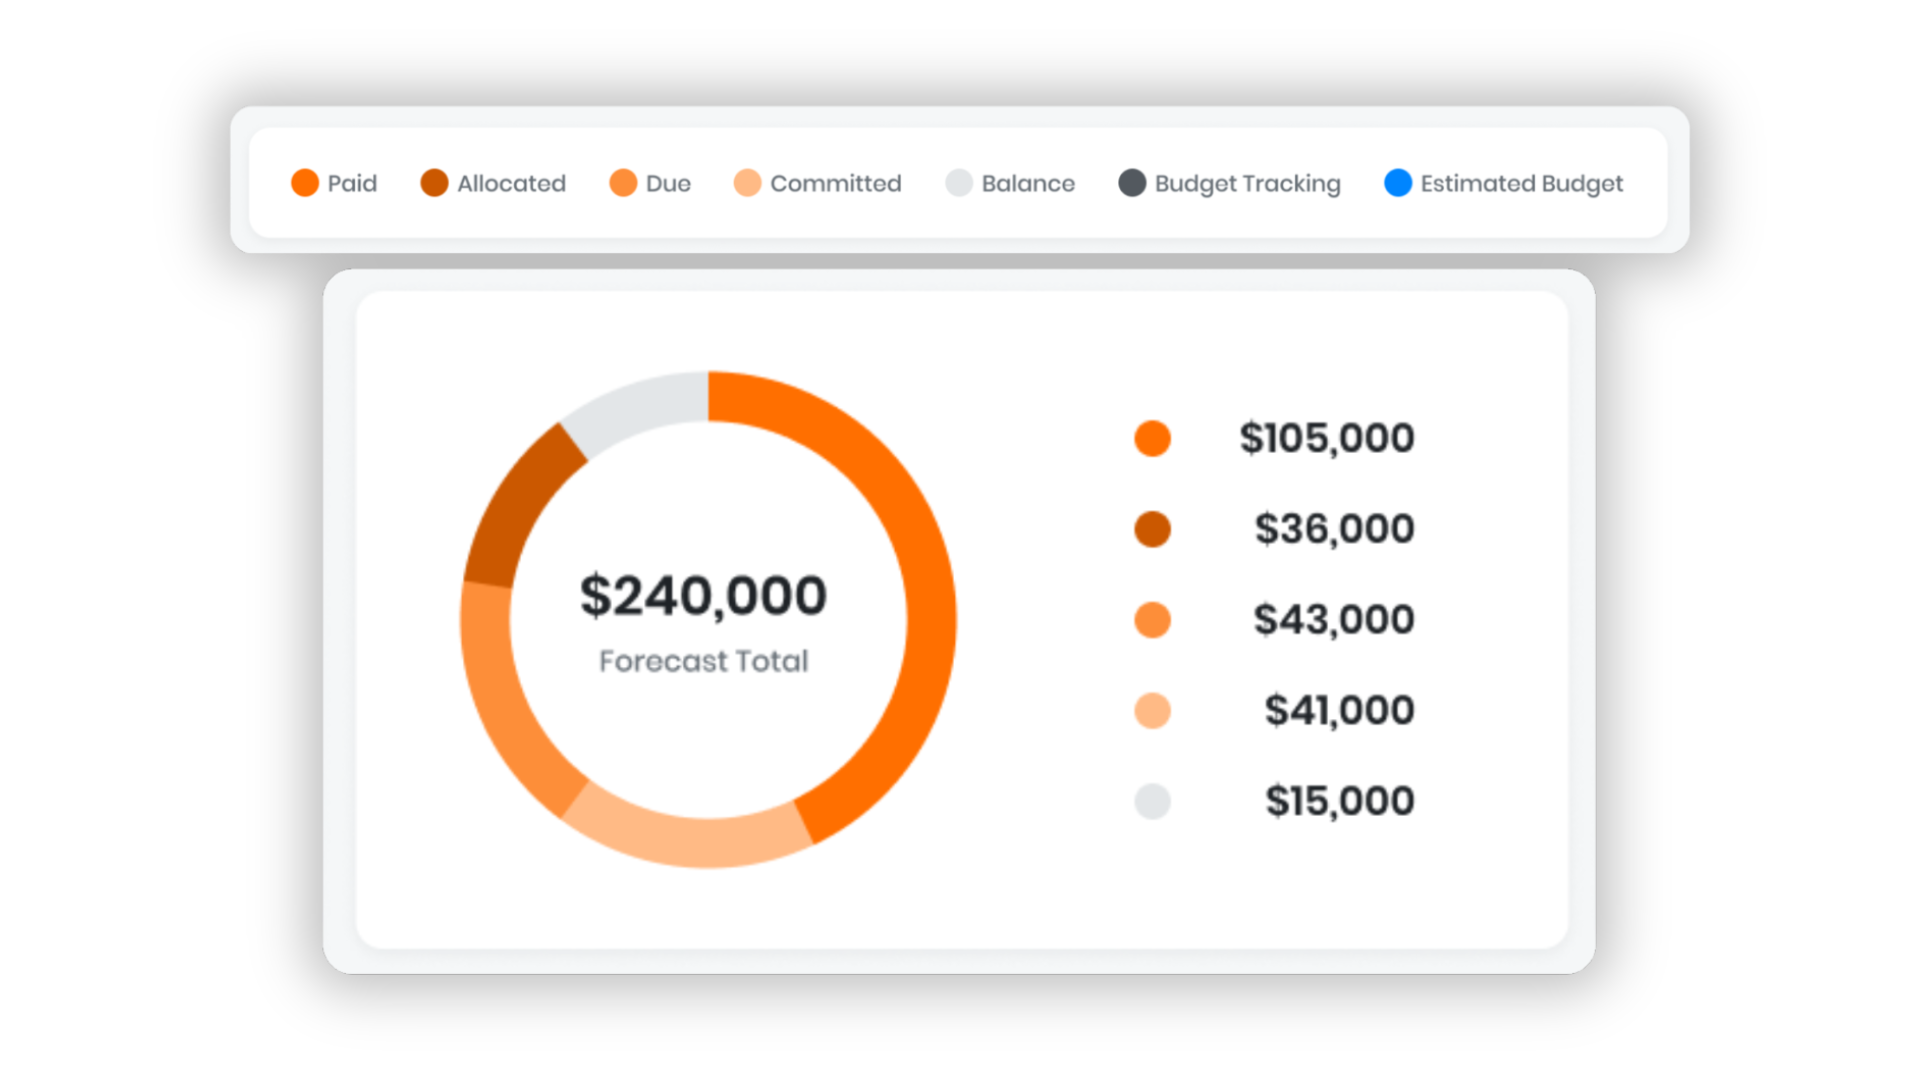
On the right side, this wheel visually shows how much of your budget has been spent and how much remains. This wheel uses the same legend as mentioned previously.
Task Progress Bar
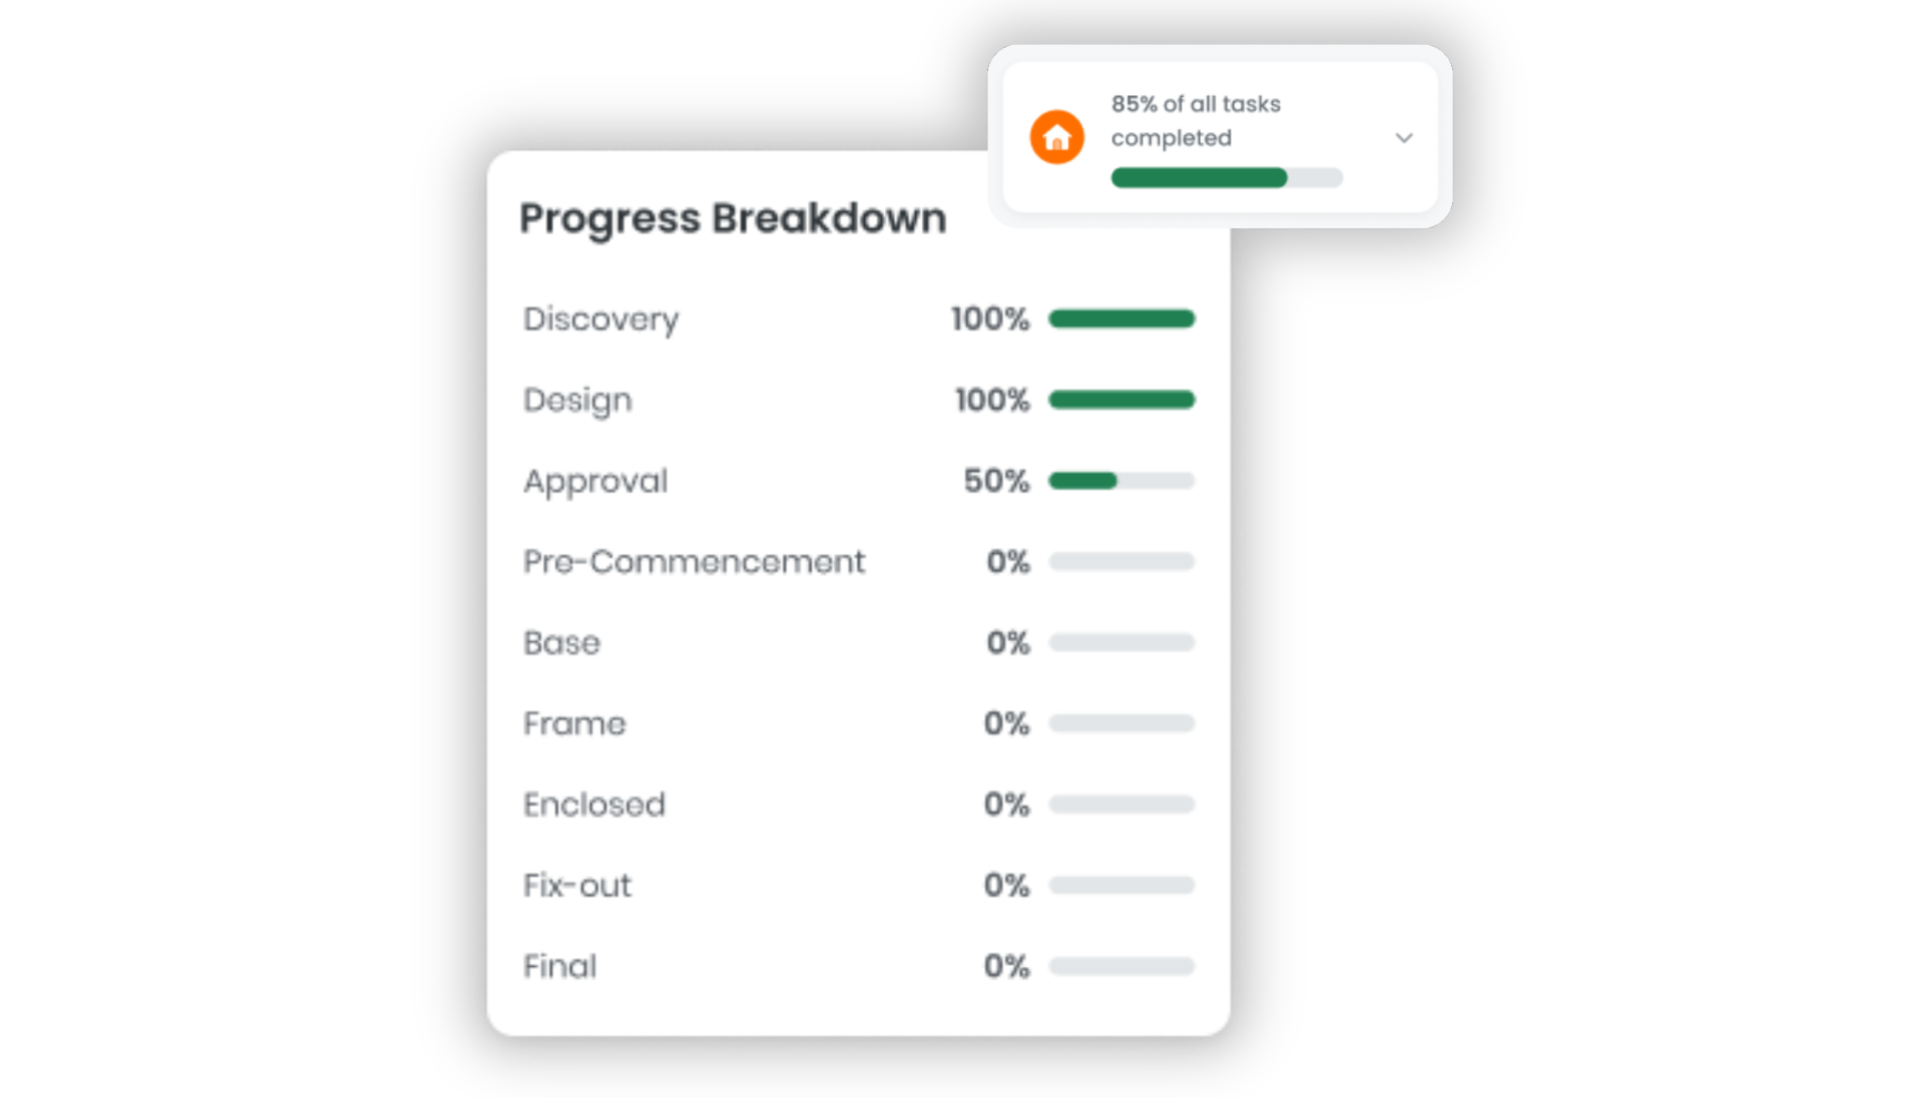
Shows the percentage of tasks completed. Click to expand for a breakdown of progress at each stage of the journey for example, design, discovery to fix-out and final.
Market Comparison
This value is how much Build Buddy has saved you so far compared to traditional builders. This is calculated based on the average cost of building a residential home with a traditional home builder.
Graphs
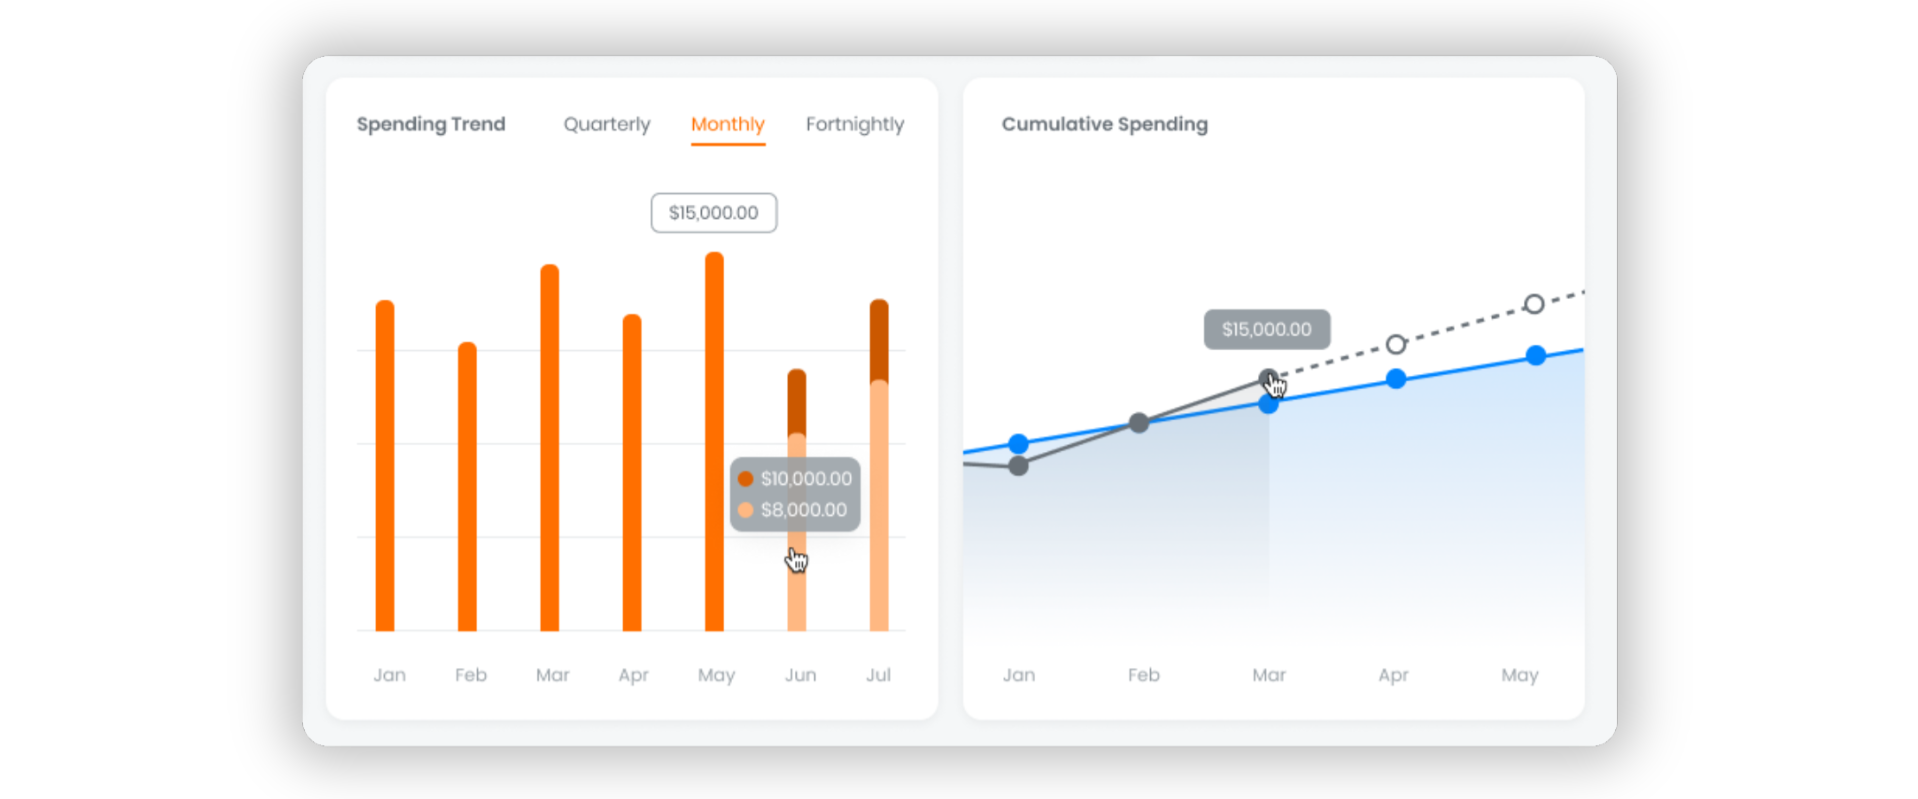
Here, you can view two different graphs:
- Spending Trend: View spending trends quarterly, monthly, or fortnightly.
- Cumulative Spending: Track your budget, estimated budget, and spending forecast over time.
This page helps you monitor and manage your spending, track your progress, and understand how your budget is performing throughout your project.
Looking for something else?

Latest news and updates